EDITORIAL UX · DATA-DRIVEN STORYTELLING
From Data to Meaningful Storytelling
Telling the story of IKEA's data-driven Life at Home Report as a global web experience
Created for IKEA
01 — INTRODUCTION
Designing a framework for IKEA’s annual Life at Home Report
Every year, IKEA publishes one of the most ambitious pieces of consumer research in the world, a study of how people actually experience life at home, conducted across 39 countries. In 2024, the Life at Home Report explored how people experience joy, belonging and wellbeing at home. My challenge was to design a global framework to reposition a dense, research-led report into a scalable digital experience that made the research accessible, emotional and actionable. Given the exhaustive, global nature of the data we were handling, we needed to ensure that the experience felt relevant across all the other markets we would be publishing this report in, simultaneously. The theme for the year, "The Enjoyment Gap" anchored the experience, drawing on the distance between what home should feel like and what it actually does.
02 — MY ROLE
Scope of Work
For this project, I led end-to-end UX strategy and experience design globally. Defined the editorial and commercial framework that structured the entire experience. I also built a modular, localisation-ready system reused across two subsequent report cycles that set the structure of how we would continue to tell the story behind the data in this report, year after year.
03 — STORYTELLING THE DATA
Exploring the Enjoyment Gap
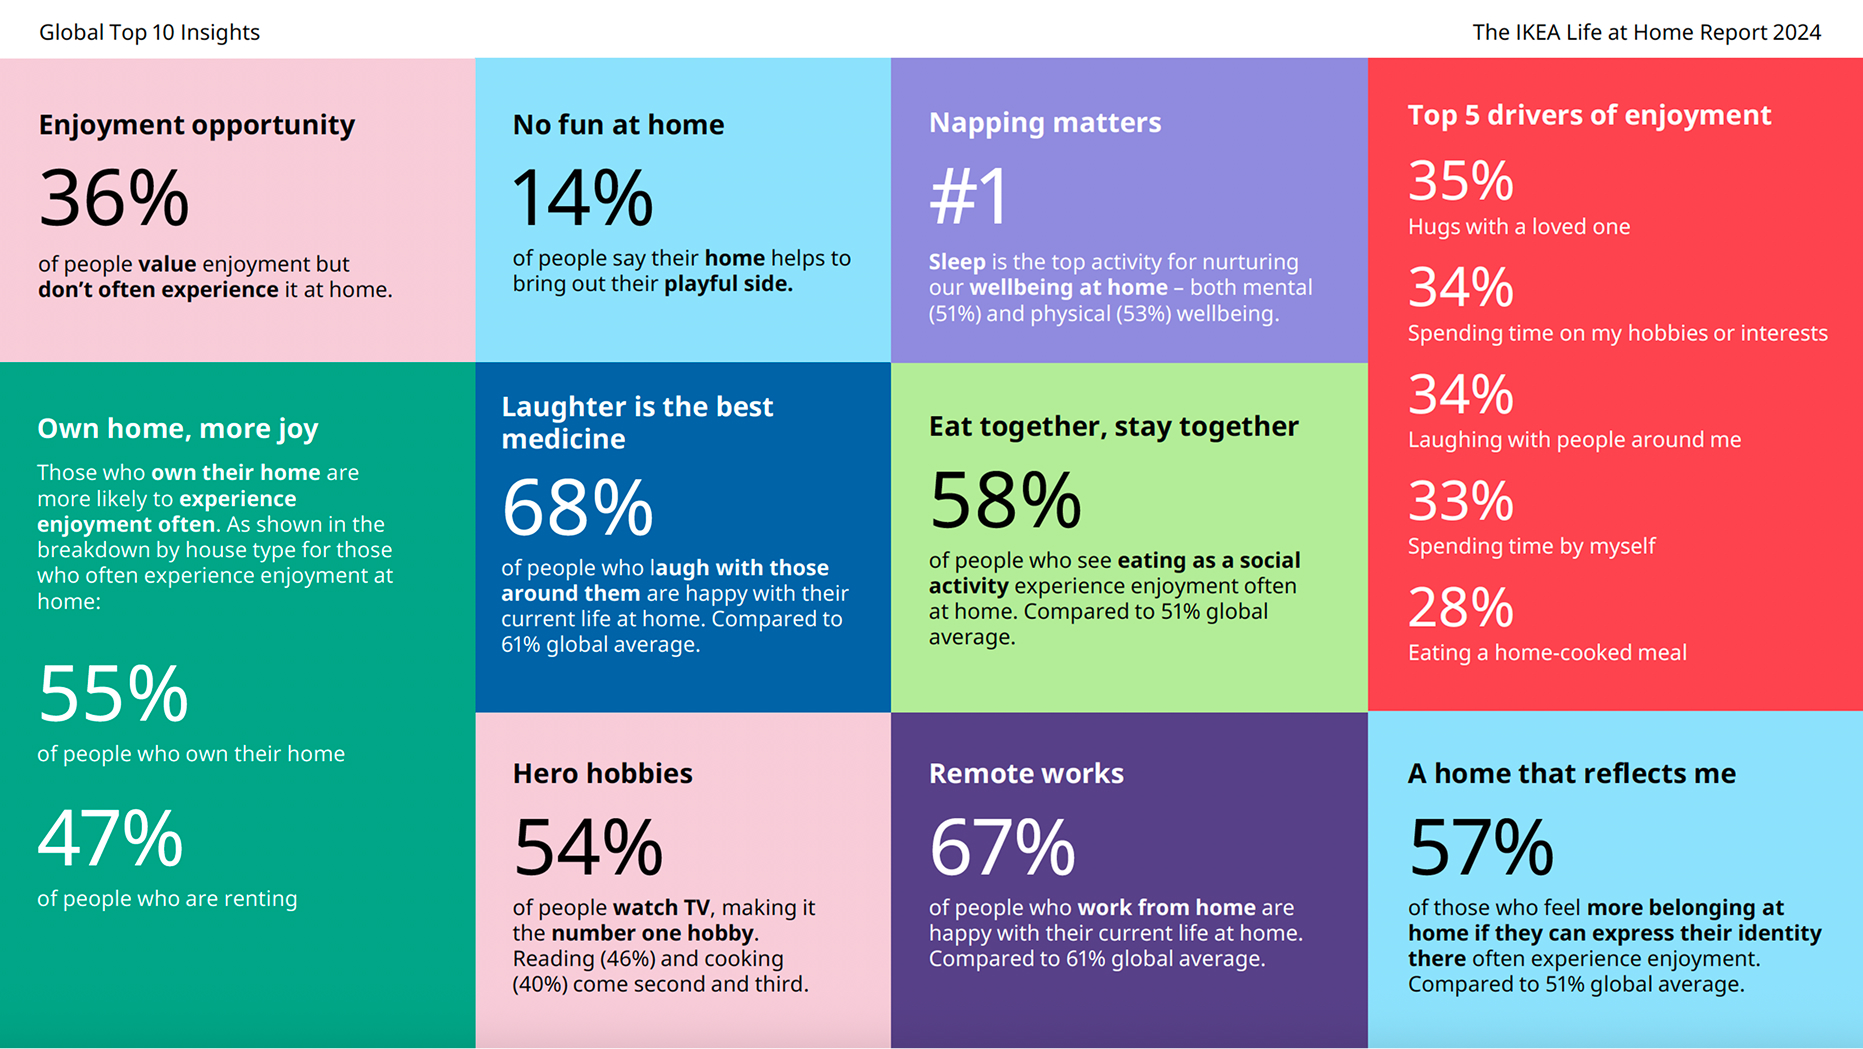
The 2024 theme, exploring "The Enjoyment Gap" positioned a tension at the heart of the experience:
Enjoyment at home is widely valued — but not consistently felt.
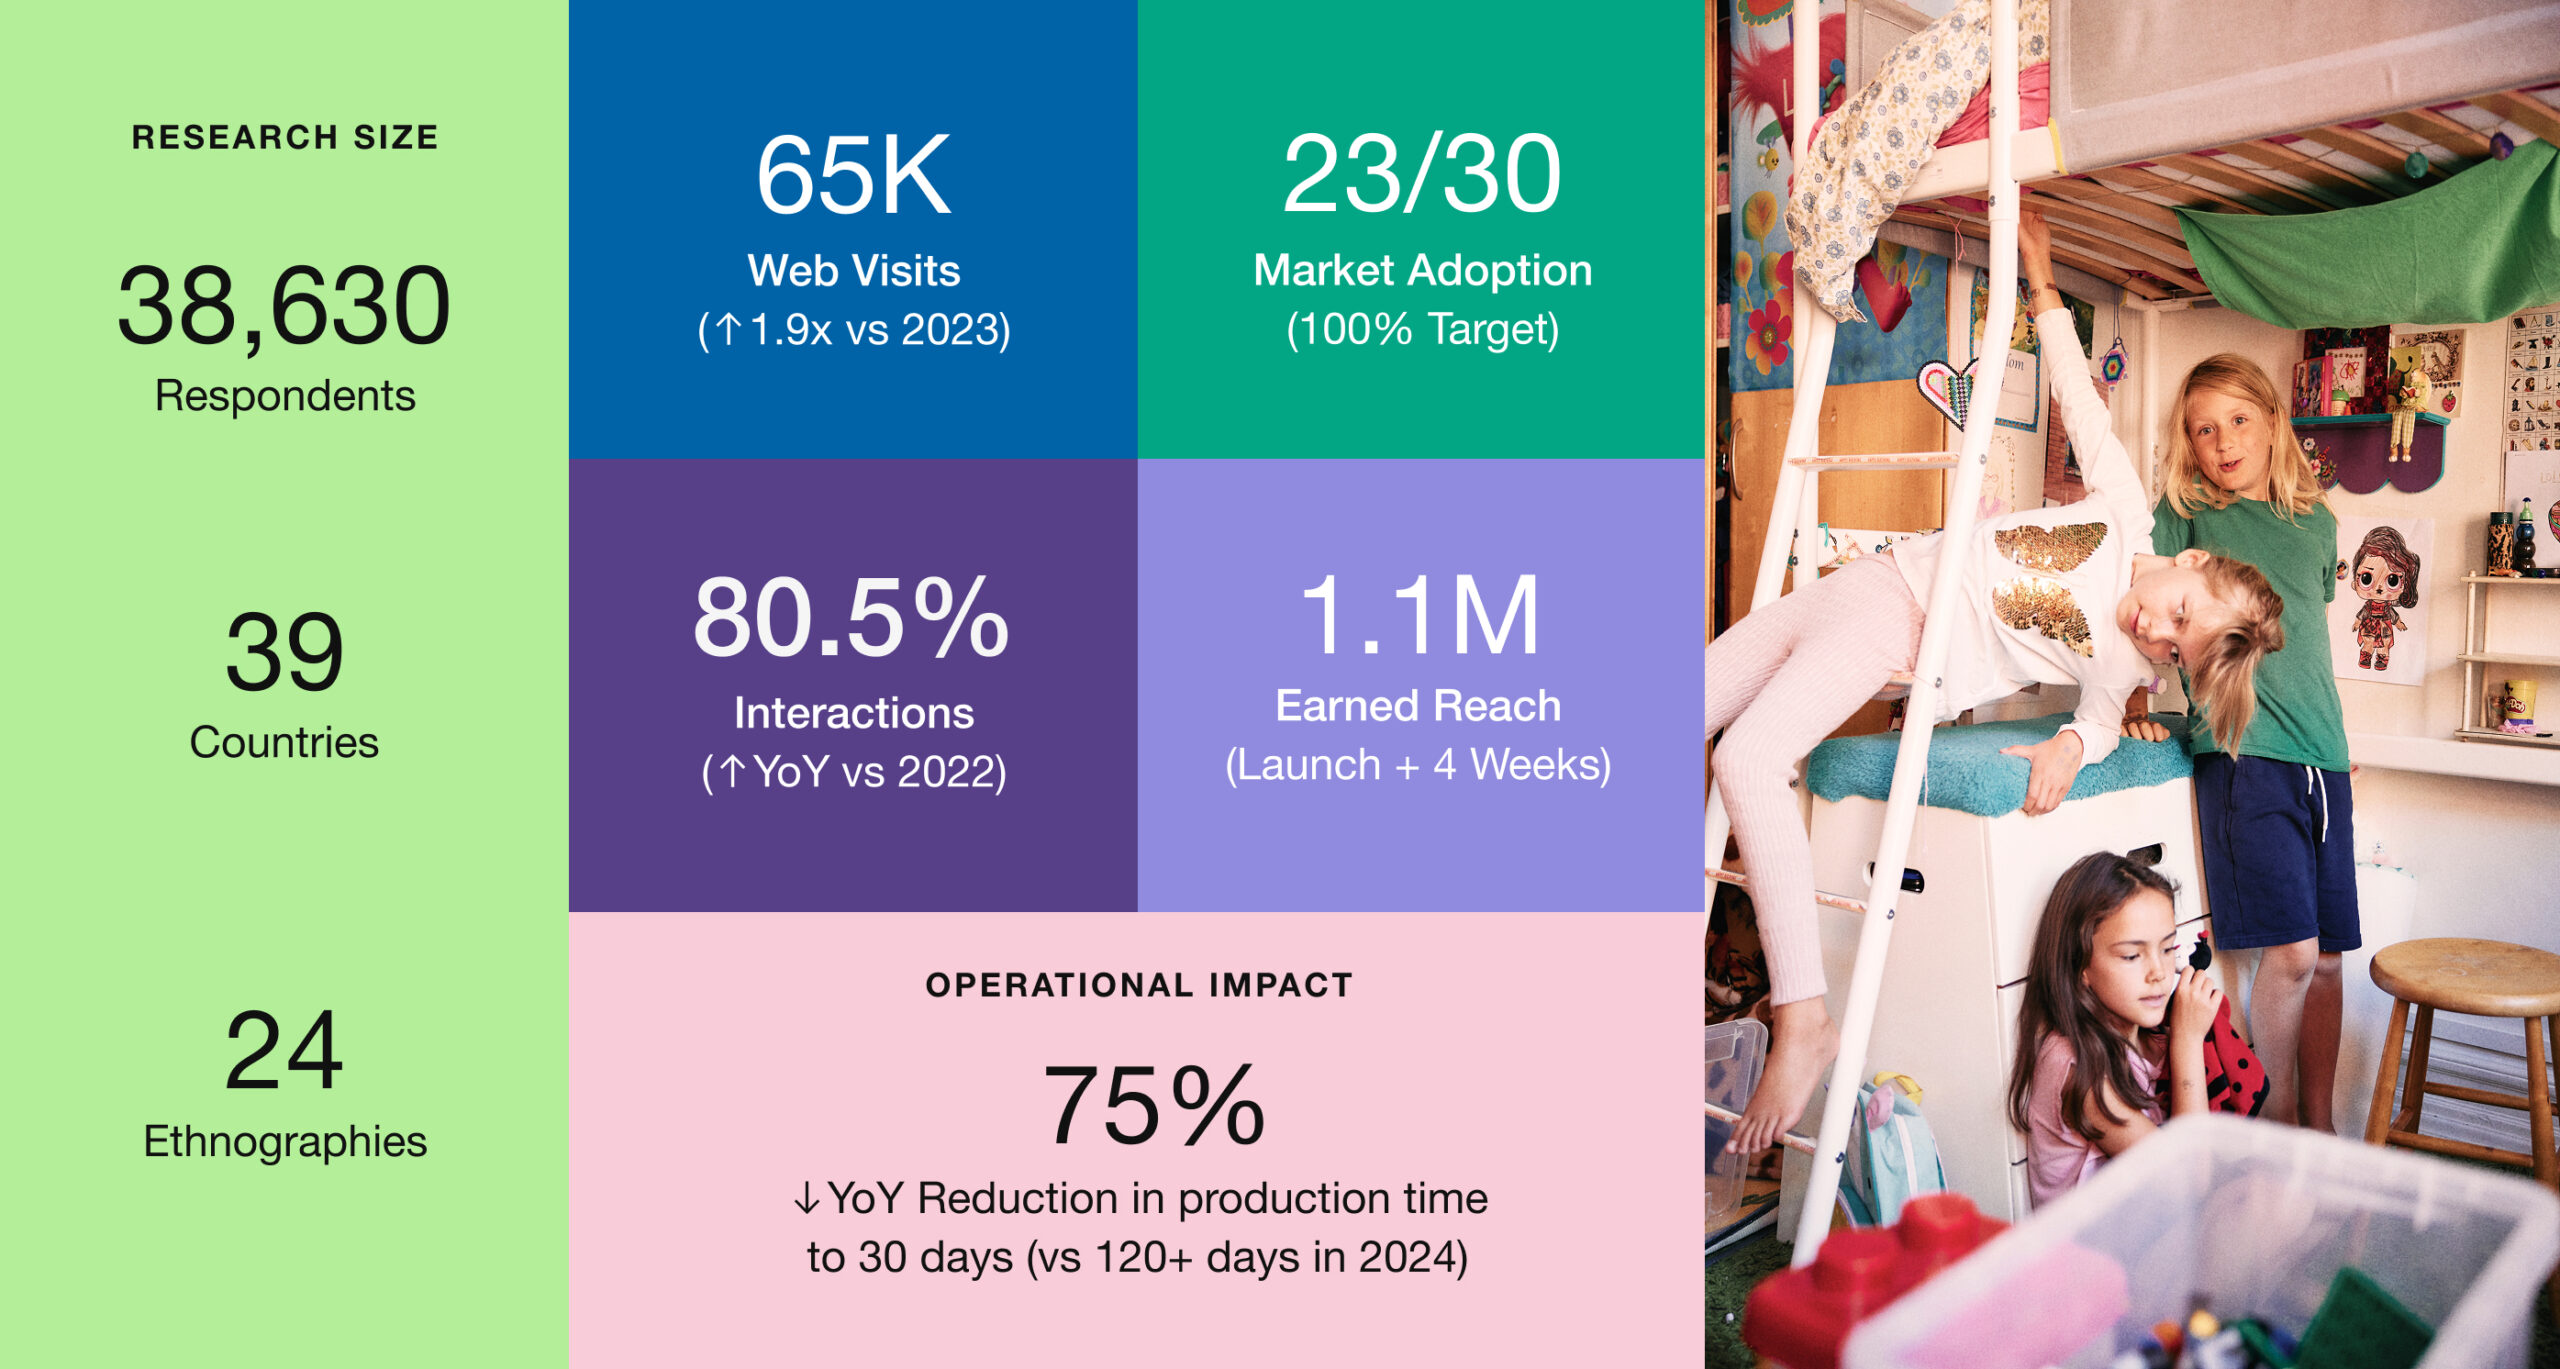
The report was based on extensive quantitative, qualitative and trend research, each type building a distinct layer of information. IKEA surveyed 38,630 people aged 18+ across 39 countries, ran 24 home ethnographies and conducted 36 digital immersions. Survey data provided global credibility, in-person interviews and direct quotes grounded each insight in lived reality and cultural trend references expanded the lens beyond the household to society at large.
This rhythm, data, voice and context ensured the numbers never stood alone. Every statistic was attached to a human experience and every human experience was situated within something larger.
The result was a research narrative that moved from tension to understanding to possibility, positioning data not as a report to consume but as a lens through which to rethink everyday life at home and be inspired by meaningful solutions to each tension.
04 A — STRATEGIC FRAMING
Connecting Insight, Emotion & Action
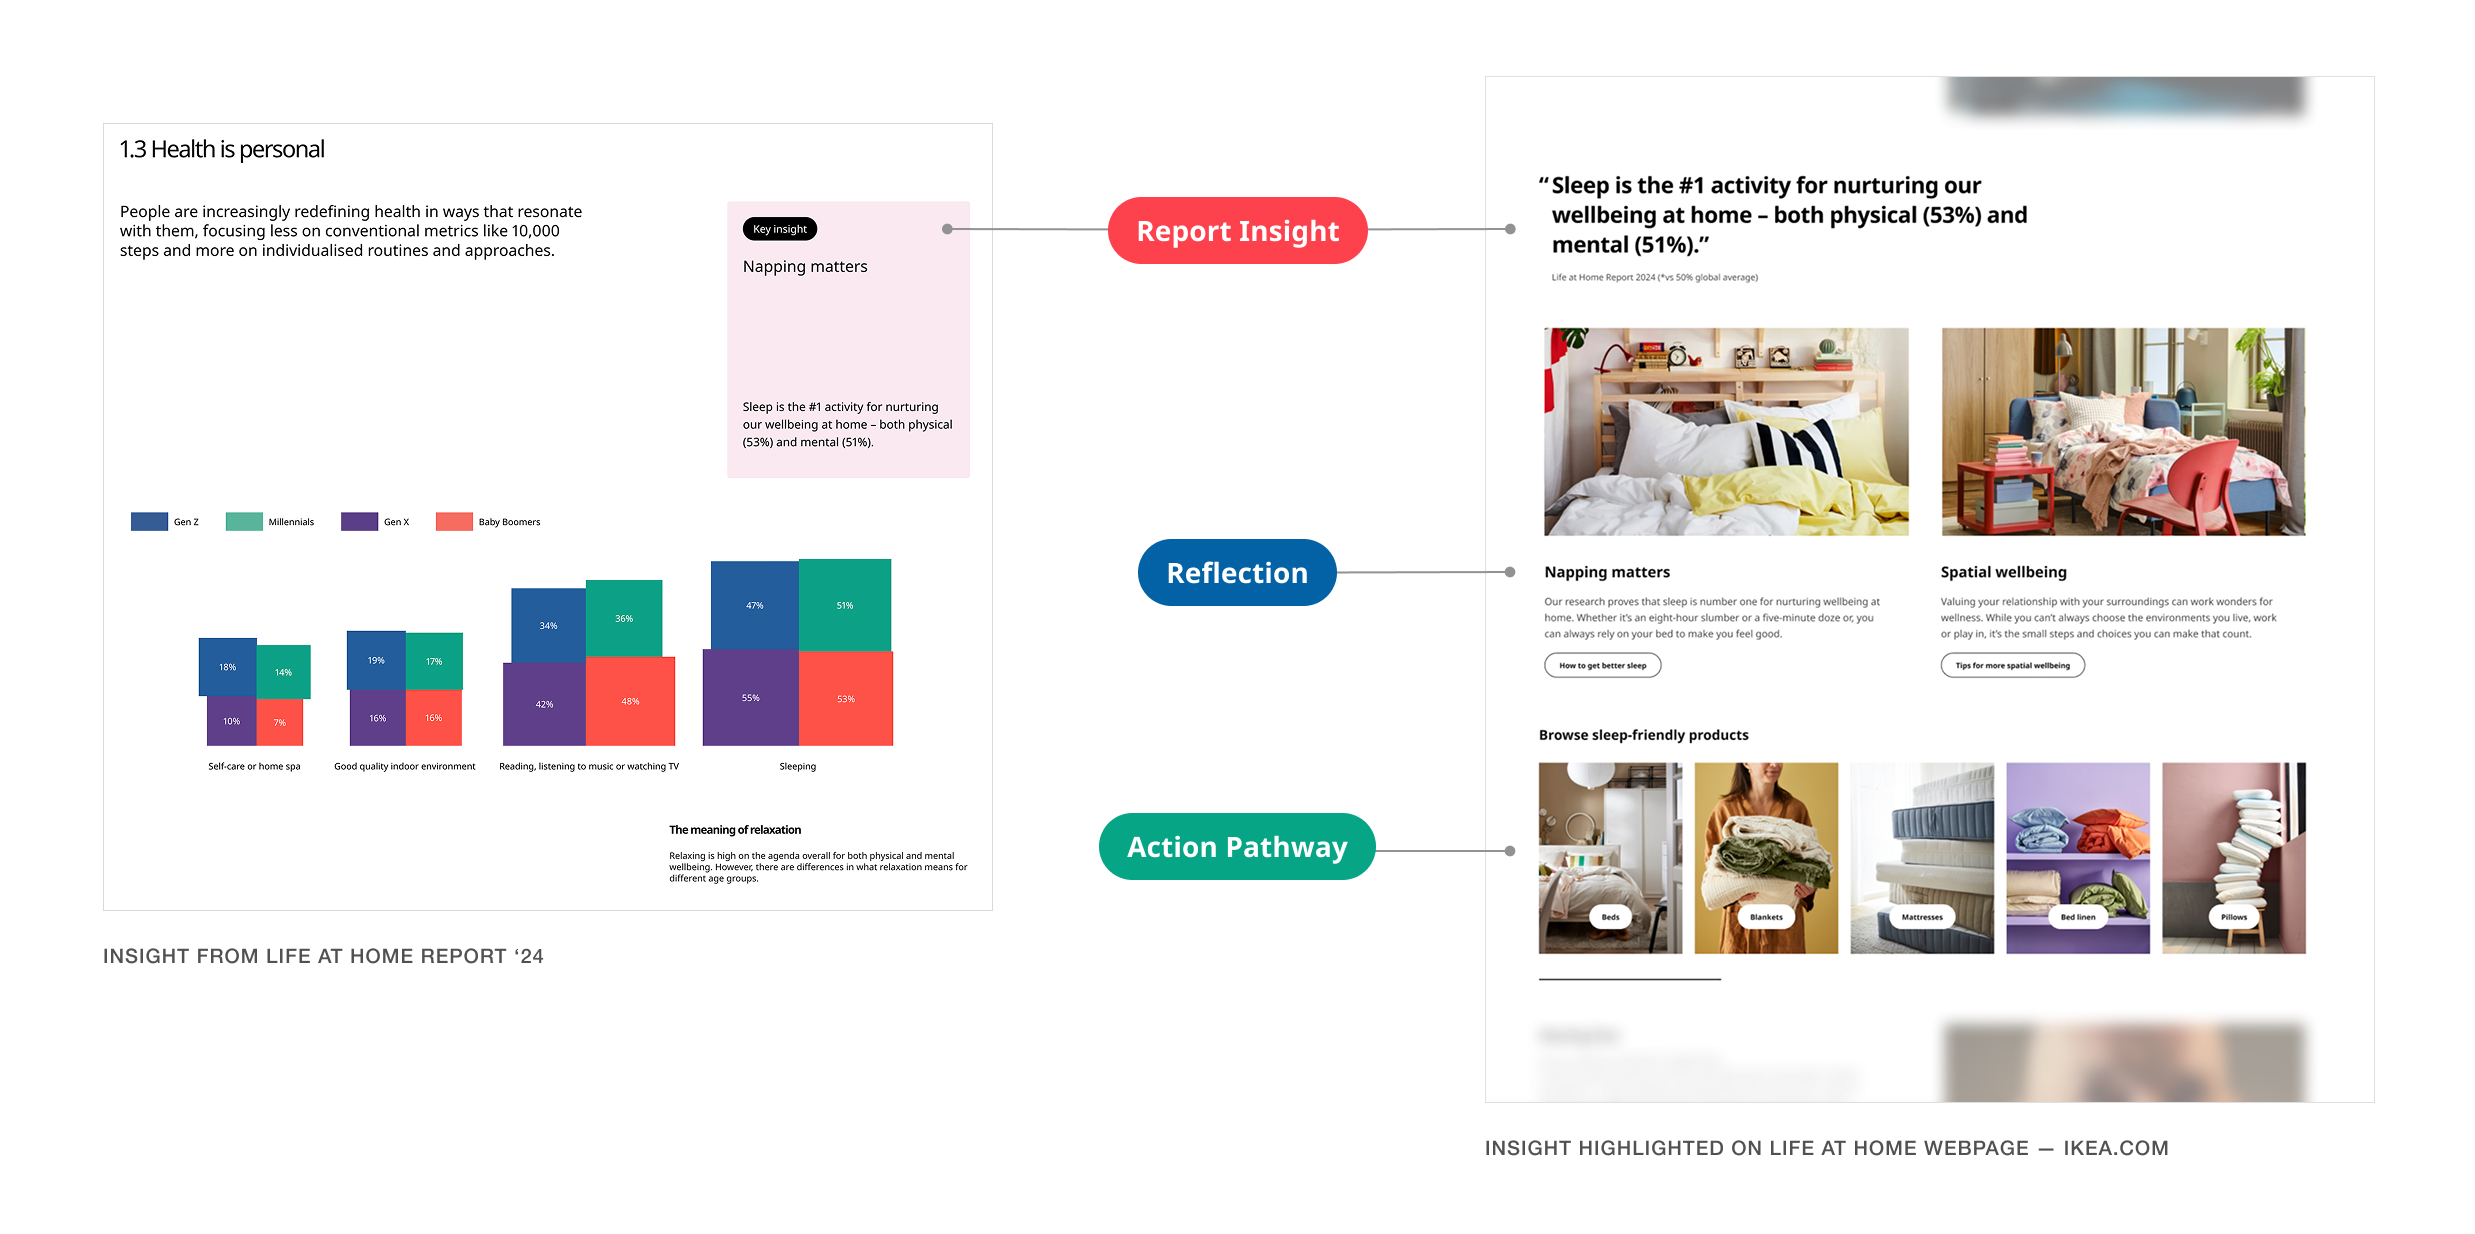
Often, research-led experiences either remain static and academic or become overly commercial and lose trust. The opportunity here was to design a storytelling model where commerce is not an interruption or an unnecessary plug but a natural continuation of the insight. When customers land on a shopping platform, commerciality is expected. Rather than expecting a consumer to interact with the report alone, I strongly proposed a continuation of the journey toward action. This was to ensure we use every opportunity to add value to the customer, when relevant, and also, to build realistic expectations with business and research stakeholders toward how such a uniqely positioned collateral can gain traction.
04 B — STRATEGIC FRAMING
Core Framework Pillars
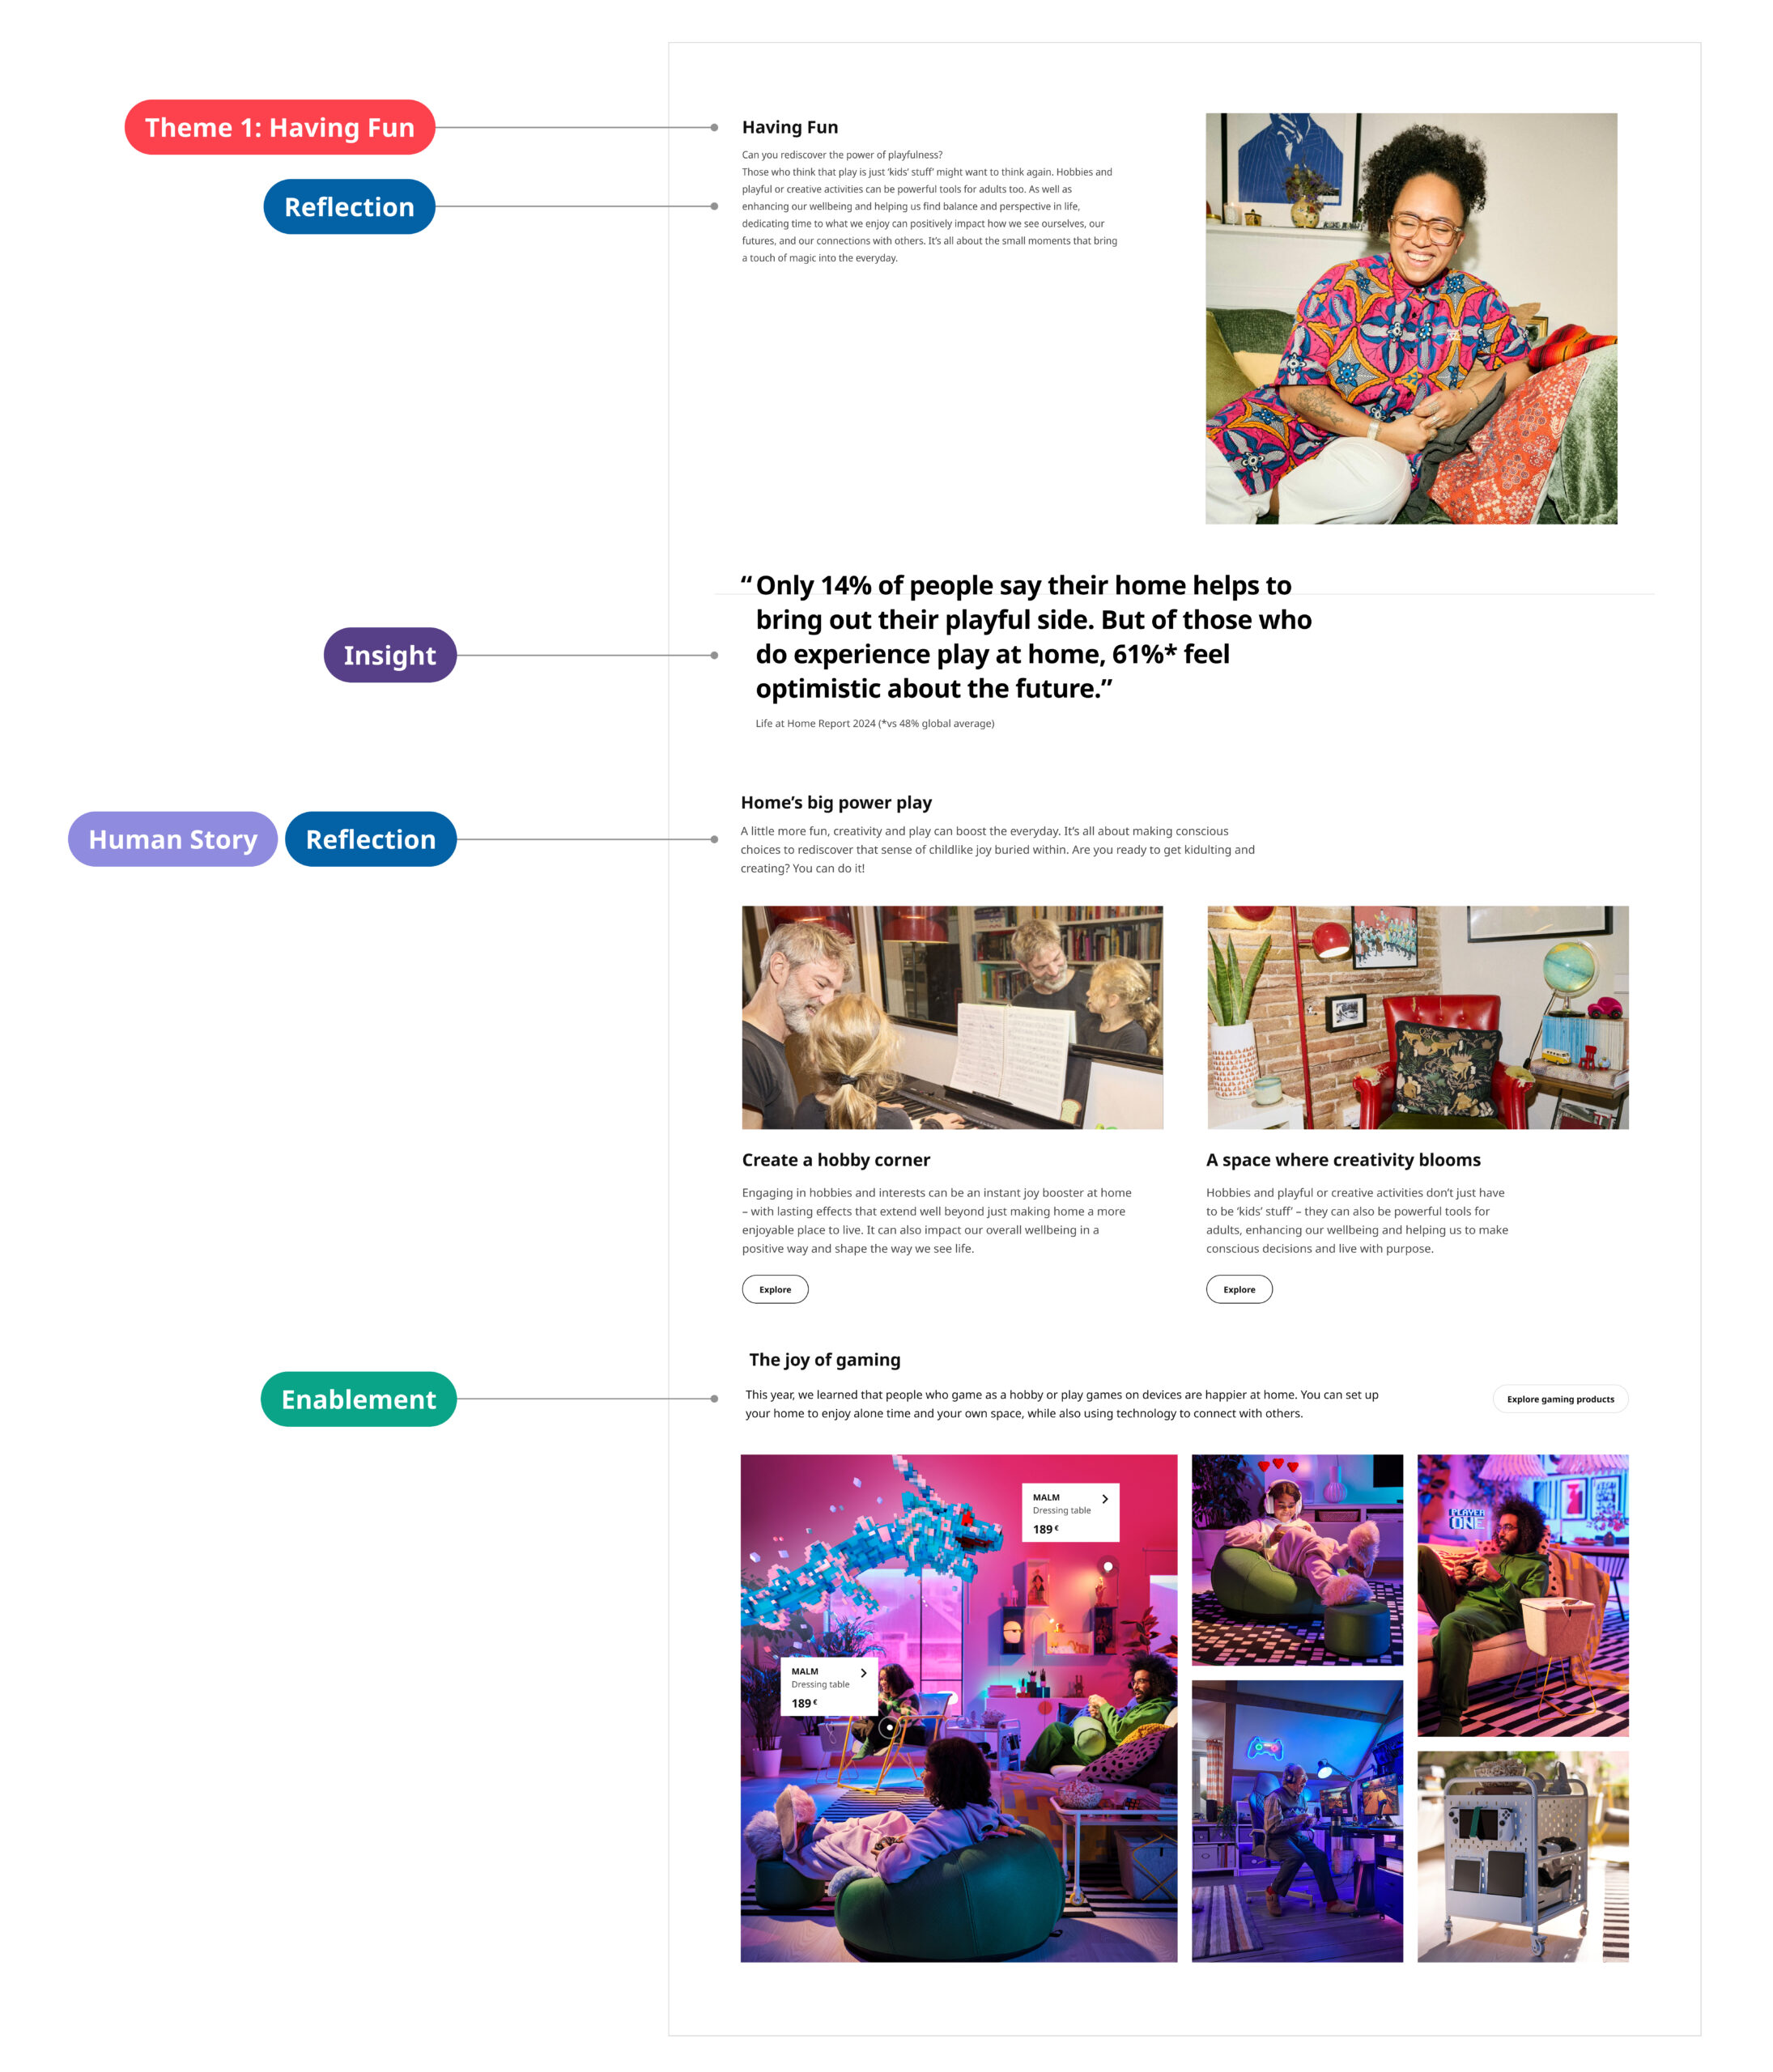
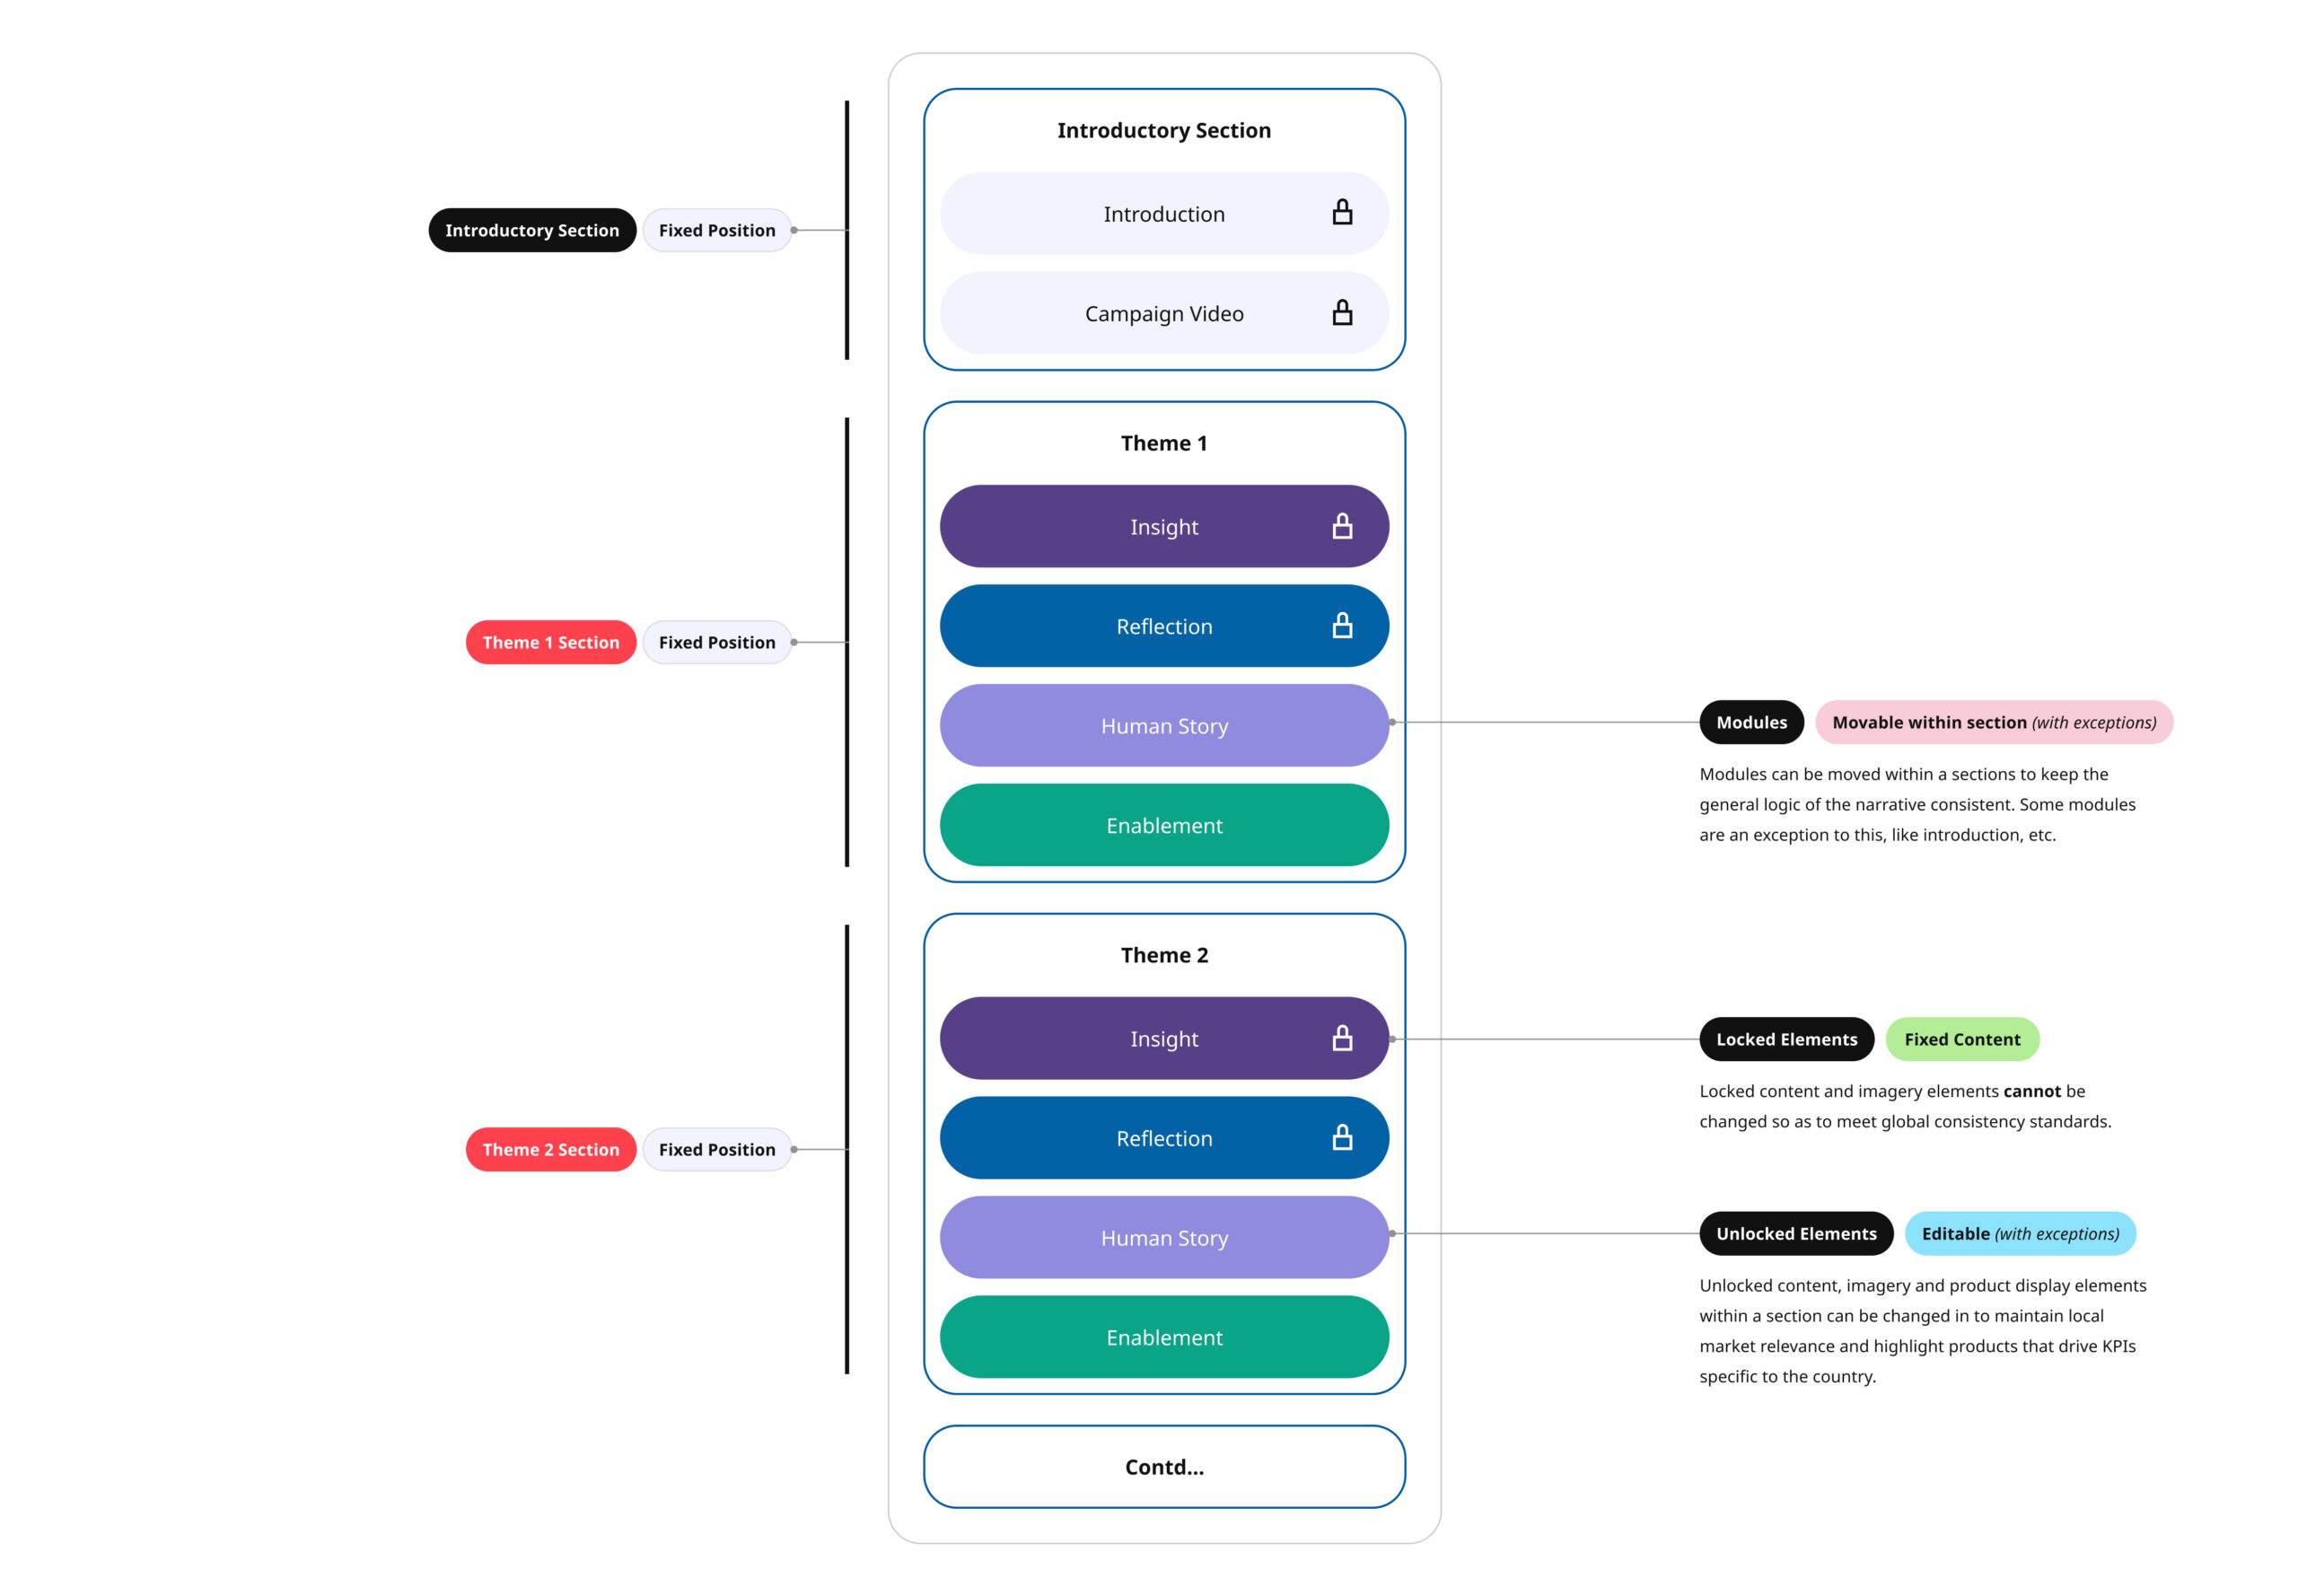
The research has uncovered four main topic areas connected to enjoyment at home – each with their own drivers and barriers: having fun, feeling good, building vibes and making connections. For each theme, I set up four pillars to tell the story behind the data: Insight, Human Story, Reflection and Enablement:
Insight: A clear, data-backed tension (eg. “Many people don’t consistently feel joy at home.”)
Human Stories: Real voices, lived moments, photography, cultural nuance to add a human element.
Reflection: What does this mean for daily life?
Enablement: A small, practical action customers can take including product pathways wherein commerce is positioned as a response to a tension or a theme, creating a closed storytelling loop.
The research surfaces a gap → The story makes it personal → IKEA offers tangible ways to address it → The customer decides whether to act.
05 — BUILT FOR SCALE
Designing for 39+ Markets
To ensure the model worked across 39+ markets and evolving annual themes, I build a modular system with flexible content blocks for localization, swappable imagery and quotes, market-specific product integration and reusable editorial templates. This created a reusable framework where research storytelling could scale globally while maintaining local relevance and commercial clarity. Product links could be localised and imagery could reflect local homes. But the underlying story remained the unifying element.
The tension between global consistency and local authenticity is one I find genuinely interesting and this project is where I developed a real point of view on how to hold both.
06 — PROTOTYPE
Life at Home, Explored
A prototype of IKEA's Life at Home Report web experience — demonstrating how global research data was translated into an editorial and retail journey, from opening narrative to product action.
07 — IMPACT
Scale, Reach & Reusability
By redesigning the report's experience into a reusable system, the Life at Home Report evolved from a passive brand artifact into an engine that bridged data and action, extending its reach from academic institutions and journals to a global ecommerce audience across 39 countries.
Web visits reached 65K at launch, nearly double the 34.3K recorded the previous year, with an 80.5% increase in interactions and 5K report downloads. Earned reach crossed 1.1M within the first four weeks, supported by 380 press and social mentions. Most significantly, 23 of 30 target markets adopted the framework, meeting the adoption goal exactly.
The framework became a reusable model that markets could activate independently year after year, which meant the design work compounded over time rather than ending at launch. What took four months to build in 2024 was reimplemented in one month in both 2025, with little to no direct design involvement, a 75% reduction in production time, delivering continued year-on-year growth in engagement while significantly reducing manpower cost.